Composite Operator: The Statistical Profile of Large Capital
1. The CO is not a conspiracy theory. It is the statistical profile of large capital.
Composite Operator (CO) is Wyckoff's model for compressing market behavior. It does not assume that one specific institution is sitting behind a screen watching you. It temporarily reads the combined behavior of funds, market makers, CTAs, pensions, corporate buybacks, passive flows, and large accounts as one actor.
This step matters. You are not looking for a hidden villain. You are asking: if large capital inside the market needs to absorb, advance, release, and press price lower, what shared traces would price and volume leave behind?
Caviro's definition is narrower:
CO = the statistical profile of accumulated turnover + price response patterns + time structure.
Accumulated turnover tells you where extended exchange took place. Price response patterns tell you whether a breakout, breakdown, or retest was accepted. Time structure tells you whether the exchange lasted long enough, or whether it was only random noise across two or three candles.
Old Wang will cut off any sentence that sounds like "the Composite Operator deliberately hit me." The market does not know who you are. It only knows where liquidity sits, who is urgent to trade, and who can wait. The value of the CO is not that it explains everything. Its value is that it filters out most fluctuations that are not worth naming.
2. The CO's 4 intents, and the one retail traders misread most often
The CO has only four types of intent. The first is Acquire: absorb supply at a relatively low area and make impatient sellers hand over inventory. The second is Mark Up: after supply decreases, price searches upward for new liquidity. The third is Distribute: transfer inventory to momentum buyers at a relatively high area. The fourth is Mark Down: after demand is insufficient, price searches downward for a new transaction area.
These four terms sound like a plot, but live trading must return to evidence. Acquire requires a long range, declining selling pressure, and recovery after a false breakdown. Mark Up requires acceptance of higher prices after a breakout. Distribute requires high-volume activity at the top while price progress becomes less efficient. Mark Down requires a failed rally after a breakdown.
Retail traders most often misread Mark Up. Every green candle looks like ignition, and every breakout looks like large capital finally "pushing the market." But random movement can also break out. News candles can also break out. Low-liquidity sessions can also break out. Wyckoff's value is filtering: without mature cause, without volume and price response, and without a held retest, do not name an ordinary rise as CO intent.
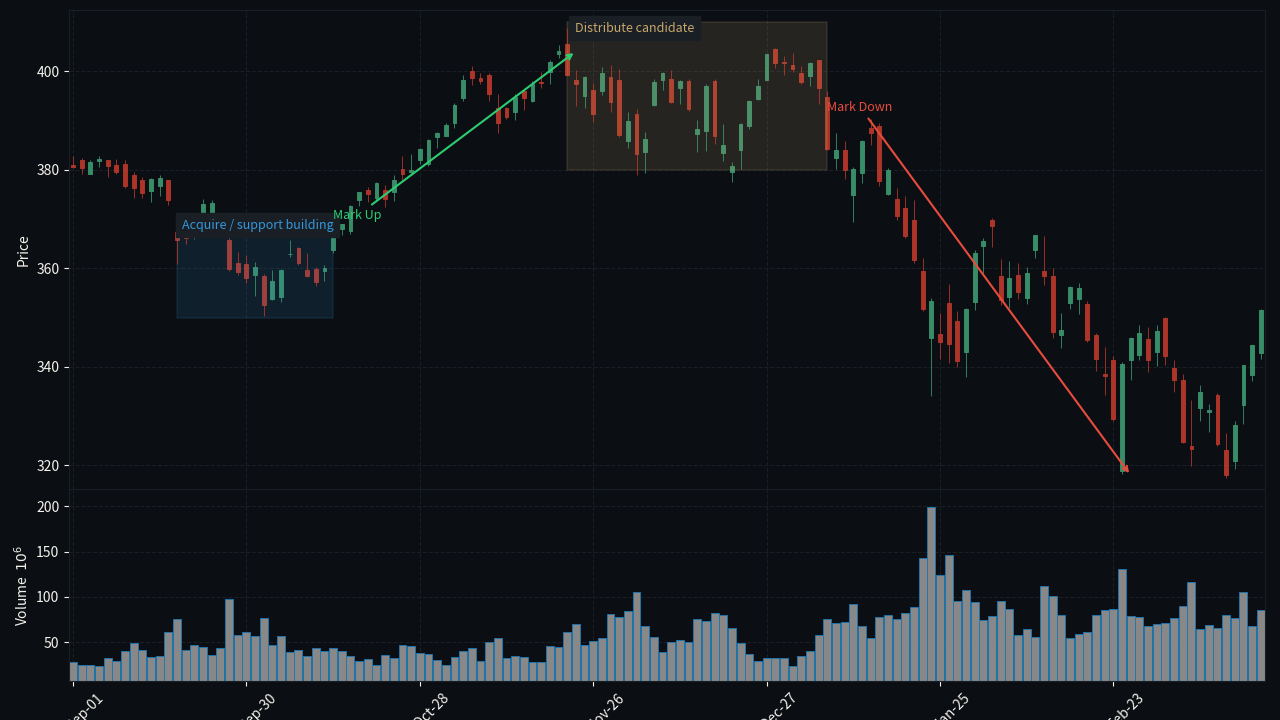
When QQQ fails a high-level breakout and sells off on volume, what is the professional first response?
3. Phases A-E are retrospective, not predictive
Wyckoff Phases A-E are easy to learn as a prediction machine. You see the decline stop and call it Phase A. You see sideways movement and call it Phase B. You see a Spring and call it Phase C. Then you wait early for Phase D and E to pay you. This way of learning makes you most confident at the least certain point.
Caviro's rule is colder:
A-E are retrospective labels. In real time, you can only write a working hypothesis.
After you have seen a full accumulation, you can look back and say Phase A was stopping action, Phase B was cause building, Phase C was the Spring test, Phase D was the sign of strength (SOS), and Phase E was trend acceptance after leaving the range. But when you are standing in the middle of Phase B, it can still become distribution, or it can simply be meaningless chop.
Every phase label must therefore carry an invalidation condition. You can write "the current hypothesis is Phase B accumulation," but the next sentence must say: if price breaks below the range low on volume and fails to recover, this hypothesis is withdrawn. Old Wang does not care how elegant your labels are. He only checks whether you know where you are wrong.
4. Volume + Price = effort versus result
Wyckoff tape reading cannot separate volume from price. Volume is effort. Price progress is result. Large effort with large result means the push is effective. Large effort with small result means the other side is absorbing. Small effort with large result means supply or demand has already thinned out.
The most important condition is Effort > Result. If QQQ prints clearly higher volume at the top but the close still cannot accept new highs, you cannot simply say "buying is strong." The same volume can also mean sellers are handing inventory to momentum buyers. If gold sells off on high volume near the lows but quickly closes back inside the range, you also cannot simply say "selling pressure is strong." Result did not keep up with effort, which means low-price supply may have been absorbed.
This is why the CO model does not rely on conspiracy theory. It reads observable imbalance: how much volume was committed, how much distance price gained, and whether later candles confirmed that result. Without later confirmation, a single large-volume candle is an alert, not a verdict.
Inside a high-level range, an up candle prints 2x average volume, but the close does not hold above the prior high, and the next two candles do not continue. How does Caviro read this?
5. Four key Accumulation events (PS / SC / AR / ST)
The early stage of Accumulation does not start with the Spring. The Spring is a later test. Four events must come first, and they are responsible for shaping the range.
PS (Preliminary Support) is the first clear demand that appears inside a downtrend. Price may still continue lower, but the decline starts to blunt. What you see is that extended down candles can no longer sustain, and volume begins to look abnormal.
SC (Selling Climax) is where panic is released in its most concentrated form. It often comes with a large range, large volume, a long lower wick, or fast recovery. SC does not equal the lowest point. It only tells you that the market has dumped out a large amount of supply for the first time.
AR (Automatic Rally) is the natural rebound after SC. It is not responsible for giving you a long signal. It is responsible for helping you draw the range high. Without AR, you do not even have the later upper boundary of the range.
ST (Secondary Test) returns near the SC to check whether low-level supply has decreased. Professional reading does not stop at "it fell back again, so it is weak." Compare effort and result: if ST volume is lower, the downside distance is shorter, and the close is better, supply is decreasing.
6. Four key Distribution events (PSY / BC / AR / ST)
Distribution is the mirror image of accumulation, but psychologically it is harder. Tops usually come with good news, strong narratives, and screenshots of new highs. Old Wang does not argue with stories. He only checks whether high prices are being accepted on a sustained basis.
PSY (Preliminary Supply) is the first clear supply that appears inside an uptrend. Price can still make new highs, but progress becomes heavy. You will see that after large volume, the close no longer easily holds above a new area.
BC (Buying Climax) is where public excitement is most concentrated. Big green candles, heavy volume, and the best-sounding news all appear there. BC is not an automatic short signal. It only tells you that demand may have been consumed in concentrated form.
AR (Automatic Reaction) is the first clear decline after BC, and it helps you draw the range low. Without an AR at the top, there is no lower boundary for the distribution range.
ST (Secondary Test) returns near the BC to check whether high-price demand is still present. If ST makes a new high but fails to close well, or if volume is large but result is small, distribution evidence increases. If ST holds higher prices, the original distribution hypothesis is withdrawn.
7. Cross-TF Wyckoff: D1 > H4 > H1 priority
Wyckoff is most easily fooled by lower timeframes. A clean H1 Spring may be only a small rally inside a D1 markdown. An H4 SOS that runs into D1 distribution supply may also be only a Secondary Test.
Caviro's priority is fixed:
- D1 phase = structural context. First judge whether the higher timeframe is an accumulation candidate, markup, distribution candidate, markdown, or invalid chop.
- H4 sub-phase = execution map. Inside the D1 context, look for smaller PS, SC, AR, ST, Spring, Upthrust, LPS, or LPSY.
- H1 trigger = entry timing. H1 can only provide close, retest, or rejection. It cannot change the D1 judgment by itself.
This rule will keep you out of many trades that look clean. Inside D1 distribution, an H1 demand trigger is downgraded by default. Inside D1 accumulation, an H1 bearish breakdown is first examined as a possible Spring test. Lower timeframes can help you carry risk precisely, but they cannot decide the major process of the market in place of the higher timeframe.
Write three lines: the D1 phase hypothesis, the H4 sub-phase, and the H1 trigger. End with the condition that would invalidate this judgment.
8. Caviro filter + live cherry-pick drill
The danger in Wyckoff is not too few concepts. It is too many concepts. Every range can tell a story, and every wick can receive a label. The Caviro filter compresses tradable samples down to very few.
First: Do not trade Phase A. Phase A is early evidence that the prior trend may be stopping, and information is at its messiest. You can observe PS, SC, and AR, but you do not rush to place a trade. At that point the range has not matured, and neither supply nor demand has completed its test.
Second: Do not chase when the Phase E breakout has already run 30+ candles. Phase E's edge is early acceptance after leaving the range. After more than 30 same-timeframe candles, the common problems are a stop that is too wide, a worse R:R, and the next pullback already approaching. Being right about direction does not mean the trade still has value.
Third: Without invalidation, do not name it. Every CO reading must be able to write one withdrawal line. The invalidation line for an accumulation candidate is usually acceptance below the SC / Spring low. The invalidation line for a distribution candidate is usually acceptance above the BC / Upthrust high.
The live drill uses six marks:
- D1 phase candidate.
- H4 range high / range low.
- Key events: PS/SC/AR/ST or PSY/BC/AR/ST.
- Effort versus Result evidence.
- Whether the current location is too early or too late.
- Invalidation and next liquidity.
If you cannot fill all six, skip it. Mature Wyckoff traders do not force an explanation onto every chart. They can quickly admit: there is not enough data here.
The CO is the statistical profile of combined large-capital behavior. It comes from turnover distribution, price response, and time structure, not from a victim narrative.
A-E phases can only be confirmed after the fact. In real time, write only candidates. Every phase hypothesis must come with an invalidation.
Volume is effort. Price is result. When Effort is greater than Result, first suspect absorption or distribution. Do not rush to follow the surface direction.
Caviro filter: Phase A is too early, and Phase E after 30+ candles is too late. In between, select only samples where the range is mature, evidence is complete, and risk can be defined.
Next lesson L3.2: Spring false breakdown: the supply test inside accumulation