MSS / CHOCH: When the Market Accepts a New Price
Start with the schematic — see exactly what "a body close below the prior HL" means — then look at how it shows up on a real chart.
Higher highs and higher lows march upward until one candle closes below the protected HL (dashed line). A wick through the level is only a visit; the body close is what confirms the CHOCH/MSS.
1. MSS is not a reversal. It is the market accepting your stop price.
When has structure truly changed? Not when your stop is touched. It changes when the market is willing to close and stay below that stop.
I assume you already understand HH/HL and LH/LL. Now we need to remove a more expensive misunderstanding: you used to treat MSS as a notification that "the trend changed." In trading terms, the more precise statement is that the market has started bidding below the old bullish defense line, and the close accepted that area.
When it appears for the first time, the protected swing is not a random minor low. It must be the last pullback low that drove price into a new high. Bulls place stops there because once that point fails, the old bullish market structure no longer deserves defense.
The core of MSS is price acceptance. One candle body close below the protected pullback low is enough. A wick through it only proves price visited that area. A close below it proves the market is willing to live in the new price zone.
Look at EUR/USD H1. 1.08441 was the key low before May 29. The 08:00 H1 candle traded down to 1.08292 and closed at 1.08372. It was not a pretty textbook arrow, but it completed the only action that mattered: close below 1.08441. That close is acceptance.
2. Three evidence levels replace terminology stacking
The most expensive mistake is treating CHOCH and BOS as the same signal. They are actually two different passes.
CHOCH works like a pause card. It says the old story can no longer be trusted unconditionally. You stop adding with the trend and reduce confidence in the old direction, but it has not given you a license to reverse.
BOS is more like passing the road test. After CHOCH, price first forms a new LH or HL, then closes through the previous key swing in the new direction. Only then does the new direction begin to have an evidence chain. You can start looking for a reverse setup, but that still does not mean chasing price.
Retest is where the market actually gets on the road. The first break of a level is only one vote. When price returns to the broken level and rejects again, it shows the other side defended the new boundary. Entry usually happens here, not when you first get excited.
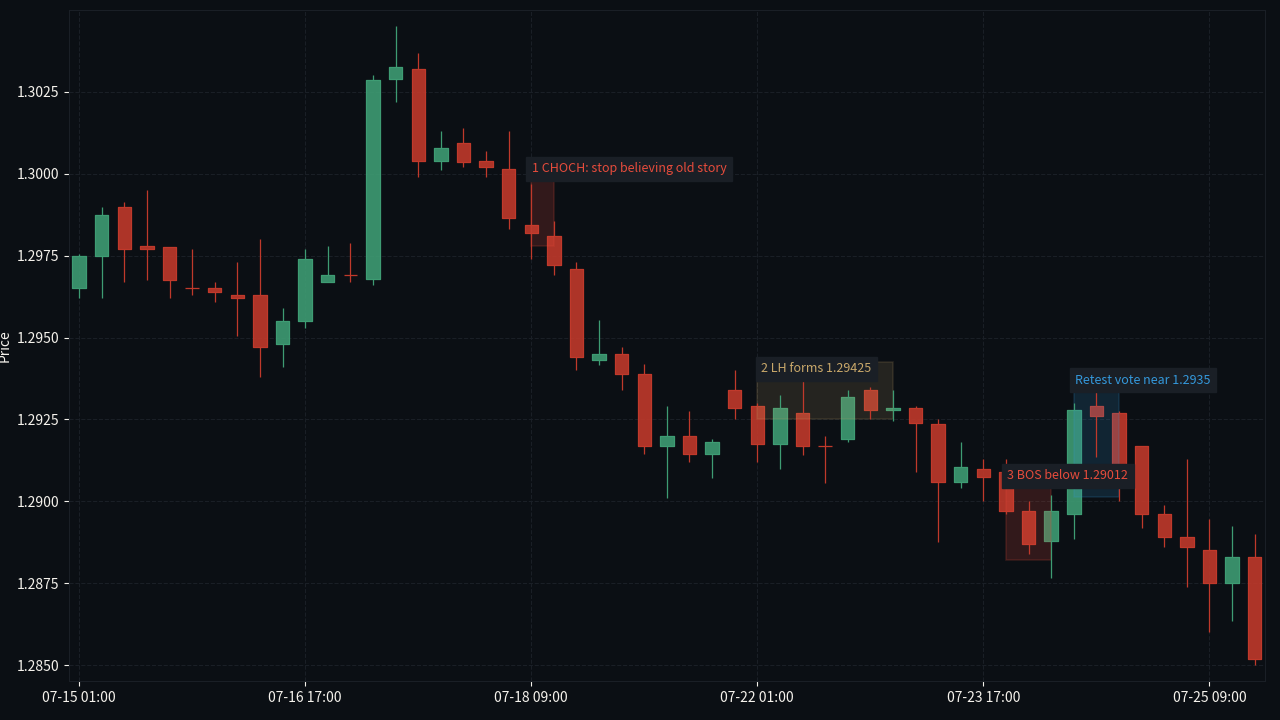
GBP/USD H4 in July 2024 followed that sequence. The break below 1.29990 on July 18 was CHOCH. First, it stops you from explaining everything with the old bullish story. The July 22 bounce only reached the 1.29425 area and formed an LH. Only after price broke below 1.29012 did it become BOS. The rejection near the 1.2935 retest is where the idea moved into execution.
When CHOCH first appears, what is the professional action?
3. Wick is a visit. Close is residence.
Price reaching a level does not mean the market accepted that level.
You need to separate wick from close. A wick shows orders traded there, like someone walked in and looked at a house. A close shows the market was still willing to stay in that price zone when the candle ended, like it actually moved in.
EUR/USD H1 gave a clean comparison near 1.08441. The May 29 04:00 candle tested the 1.08441 area with its low, but closed back at 1.0847. It visited the defense line; it did not live there. After the first close below at 08:00, price even reclaimed 1.08441 for a few hours. Only the back-to-back closes at 13:00-14:00, at 1.0838 and 1.0815, are true residence.
Same line, two candles, two conclusions. The first tells you sellers tested the area but did not complete acceptance. The second tells you the old bullish defense line lost close support. If you mix those together, your review will always sound like hindsight.
4. CHOCH is suspicion, not conviction
The first MSS is there to make you stand down, not to make you rush out and judge the market.
CHOCH is only the first damage to the old trend. It makes you stop adding with the trend, close down risk in the old direction, and wait for the next piece of evidence. It is not responsible for telling you that a new trend has already been established.
In our internal review language, less than 40% of all CHOCH events produce BOS confirmation within 24 hours. In many samples, the more common path is CHOCH-then-reclaim: price breaks once, reclaims the old structure, and the old trend or range continues.
EUR/USD on May 31 is that counterexample. The 01:00-02:00 candles closed below 1.0827 in a row (as low as 1.0812), which looked like bearish continuation. But by 12:00, price closed back to 1.0880 and reclaimed the short story that had just formed. If you reversed on CHOCH alone, your entry became fuel for someone else's cover.
The operating meaning is simple: after CHOCH, close risk; do not assume directional reversal. Shut down confidence in the old direction, but give trading permission for the new direction only to BOS and retest.
5. BOS = the evidence chain is established, not a bigger MSS
BOS is not an intensified version of CHOCH. It is a different type of evidence.
The operating definition needs to be explicit. In an old uptrend, CHOCH appears first. Then price fails to bounce and forms an LH. Then it closes below the key low before the new structure. That is bearish BOS. In an old downtrend, reverse the logic: CHOCH first, then HL, then a close through the key high before the new structure.
Why add this step? Because CHOCH only proves the old story has a problem. LH proves the buyer bounce failed. BOS proves sellers did not just pierce the old defense line; they can also keep pushing into a new low. This is a second independent piece of evidence, not the same sentence said twice.
The GBP/USD H4 chain is clear: after 1.29990 was closed through to the downside, do not call it a full reversal yet. Price bounced into the 1.29425 area but failed to reclaim the high, forming an LH. Only after it broke below 1.29012 did the new direction show structural continuation.
I like to call this step "the judge hearing both sides." CHOCH is the prosecution's first sentence, LH is the defendant failing to rebut, and BOS is the second independent evidence becoming valid. Trades are not convicted on the first sentence.
6. Retest = the market's second vote
The first break only proves one side can punch through. The second retest proves the other side cannot take it back.
Entry definitions must be executable: price returns within 5-8 pips of the broken level, or for products like gold, into a reasonably tight zone; wick rejection appears; then price closes back outside the level. For shorts, the upper wick stabs back above the broken level and the close returns below it. For longs, reverse the logic.
The stop does not go where your mind feels comfortable. It goes above the rejection wick high. Design the target first around 1.5R to 2R. This process tells you where you are wrong before entry, instead of forcing you to invent reasons after the loss.
The XAU/USD example uses a mid-September 2024 H4 window: 2589.70 is the broken level (the former EQH). After the September 19 close above it, price retested the 2584.9-2592.7 zone in the early hours of September 20 and closed back above. Entry is referenced near 2594, the stop goes at 2582, below the 2584.9 rejection wick, and the first target is 2618 (about 2R). The point is that every risk number is written before entry. The levels themselves are not magic.
If the retest candle closes back on the other side of the broken level, the setup is invalid. You do not need to debate whether the market made a false breakout. You only need to execute invalidation.
7. Caviro filter: do not chase a 1.5x ATR MSS candle
The more violent the break, the more it makes you feel you must enter immediately, and the more easily it destroys the trade.
The rule is direct: if the true range of the MSS candle is greater than 1.5 times the 20-period H4 ATR, skip. The reason is not direction. The reason is trading conditions: the stop is forced wider, R:R gets compressed, and often there is no retest afterward.
The GBP/USD H4 impulse around July 18 at 08:00 is a useful counterexample. It crossed through 1.29990 quickly, but did not offer a clean retest afterward. If you chase the short, it is easy to buy a position with a 40-50 pip stop that has emotional advantage but no execution advantage.
This filter is counterintuitive, but important in live trading. Caviro does not reward you for catching every large bearish candle. Caviro rewards you for trading only structures where stop, entry, and target can all be valid at the same time.
8. Live cherry-pick drill: you only need 5 markers
The more information you put on the chart during review, the easier it is to miss what actually matters.
For any MSS case, your eyes scan only 5 markers. First, protected swing: which HL or LH in the old trend was truly protected, and what price was it? Second, MSS close: which candle body crossed it? Third, retest zone: where is the execution area around the broken level?
Fourth, rejection close: where did the candle close after the second retest? Fifth, invalidation: what condition invalidates the entire idea? It must be written in advance. Without the fifth item, the first four are just pretty annotations.
EUR/USD H4 from late August to mid-September 2024 can serve as a template. The area near 1.10650 was the old bullish defense after the September 6 bounce. On September 9, price closed below it and formed MSS. On September 11, the retest into 1.1047-1.1055 was rejected, with the rejection close still below — only then does entry matter. Invalidation goes above 1.11025 because that would reclaim the retest structure.
This chart gives you a visual standard, not an answer template. A good structure chart does not need 19 arrows. It only needs to show at a glance: who was protected, who was accepted through, where the second vote happened, where entry belongs, and where I am proven wrong.
Mark 5 things on the chart: protected swing, MSS close, retest zone, rejection close, and invalidation.
MSS = the closing price accepted the new pricing outside the old defense line. Wick is only a visit; close is residence.
CHOCH means stand down, BOS gives direction, retest executes. They are evidence levels, not three synonyms.
Write invalidation first, then talk about entry. A structure annotation without invalidation is just hindsight storytelling.
The NPS + WTP feedback below tells us whether this lesson made you more willing to pay, or only made you memorize more acronyms. Fill it in based on your real reaction.
Next lesson L2.2: Liquidity Map — Prior Highs/Lows / Equal Highs/Lows / Stop Pools