Rate Differentials and the Real USD Relationship — Not Betting Direction on NFP
Retail FX traders often make one mistake: they see "strong NFP -> USD should rise" and immediately long DXY. After watching it for three months, they find the rule does not work. NFP often embarrasses that logic. Macro is not useless; the framework is wrong.
Central bank policy drives FX, but the path is not a straight line from news to price. The real chain is expectations vs reality = repricing direction. Whether NFP is strong is not the main question. What matters is how much NFP changes the market-implied probability for the Fed's next meeting.
This lesson teaches the rate differential framework: how rate differentials actually affect USD pairs, gold, crypto, and US equity indices. This is not "how to predict NFP." It is "how to read what NFP did to rate-cut curves."
1. The Operating Definition of Rate Differential
The operating definition of rate differential is simple: the gap between two currencies' central bank policy rates, or more practically, the market-implied gap between their future policy paths. The first is the spot nominal differential. The second is the curve-based forward differential.
Take EUR/USD. The EUR/USD rate differential can be written as ECB deposit rate - Fed funds rate. In the 2024 high-rate cycle, a common reference point was Fed funds at 5.25-5.50% versus the ECB deposit rate at 3.75%. Using the midpoint roughly, 3.75% - 5.375% = -1.625%. A negative differential means holding USD pays more interest, giving USD a structural bid over the longer run.
But that is only the starting point. The real driver of FX is not today's spot rate. It is the future expected rate differential. If the Fed has not cut rates yet, but the market suddenly reprices the next six months of cuts from 50 bps to 125 bps, USD can fall first. The future yield differential has already narrowed.
Forward expectations come from tools such as the OIS curve, Fed funds futures, the SOFR strip, ECB OIS, and BoE OIS. You do not need to build a full curve on day one. But you should at least know this: when EUR/USD moves sharply, your first question should be "Which curve was repriced, the Fed curve or the ECB curve?" not "Does the headline look good?"
Three frameworks are used most often.
The first is carry trade. Borrow the low-yielding currency and buy the high-yielding currency. Because JPY has stayed near zero rates for a long time, it often serves as the funding currency. During the phase when the Fed was above 5% and the BoJ was near zero, USD/JPY was the carry trade favorite. Price does not rise every day, but carry gives the trend persistent gravity.
The second is rate-cut bets. When the market expects Fed cuts to accelerate, USD is often pressured. This is not because the Fed has already cut. It is because the market has removed the future USD yield advantage in advance.
The third is repricing speed. After important data, rate expectations often complete most of their repricing in the first 30 minutes. USD moves immediately after NFP not because NFP has magic, but because it changes the implied probability for the Fed's next meeting, the meeting after that, and the year-end policy rate.
Sarah's first rule is this: learning to read Fed funds futures matters more than memorizing the NFP headline.
2. Real Rates Matter More Than Nominal Rates
The nominal rate is the central bank policy rate, such as Fed funds at 5.25%. The real rate is the nominal rate minus expected inflation. The commonly used 10-year real yield can be understood approximately as:
10y Treasury yield - 10y breakeven inflation = 10y real yield
Example: if the nominal 10y yield is 4.30% and the 10y breakeven is 2.40%, then the 10y real yield is 1.90%. This is closer to the core of asset pricing than looking at 4.30% alone, because investors care about the real return after future inflation.
Why is the real rate more important?
Gold has the clearest inverse relationship with real rates. When real rates rise, the opportunity cost of holding gold rises, pressuring gold. When real rates fall, the relative appeal of a non-yielding asset rises, making it easier for gold to attract bids.
Tech stocks, especially QQQ, are also sensitive to real rates. A higher real rate means a higher discount rate, so future cash flows are discounted more heavily and valuation pressure on growth stocks increases. When real yields spiked in H1 2022, QQQ suffered a large drawdown. That was not a coincidence.
The real driver of USD is also closer to the real yield differential, not the nominal differential. A country may have a high nominal rate, but if expected inflation is even higher, the real return may not be high. The FX market ultimately buys relative real return.
Real rates have two components: first, nominal yield from the Treasury market; second, inflation expectations from the TIPS market and the breakeven curve. After CPI is released, the market reaction depends on which component moves more.
If CPI is above expectations, nominal yields usually rise because the market delays cuts or increases the tail probability of hikes. But long-run breakevens may not rise by the same amount, because a more hawkish Fed anchors long-term inflation expectations. The result is that nominal yields rise more than breakevens, so real yields rise. When CPI is below expectations, the reverse often happens, and real yields tend to fall.
Sarah's anchoring framework is called Real-Yield Refraction: real yield -> USD strength -> gold / stocks / risk assets. One CPI print does not only affect EUR/USD. It refracts through real yields into gold, QQQ, BTC, and high-beta FX. You may be trading gold, but what you really need to read is real yield.
3. Multi-Asset Case Study: One Rate Line Refracted Into Four Asset Classes
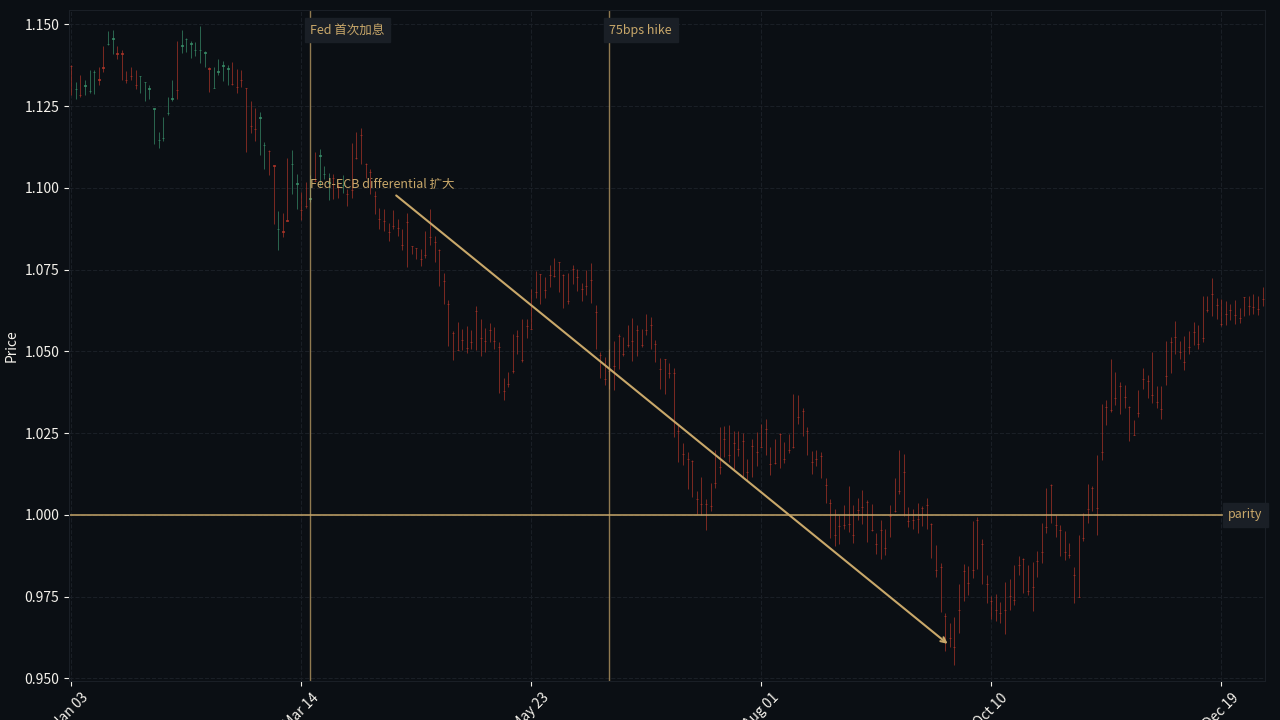
EUR/USD and the Fed-ECB rate differential are the cleanest entry-level chart. Use a 2-year lookback and place EUR/USD against Fed funds - ECB deposit rate, or against the 2-year yield differential. When the Fed hikes and the ECB lags, the differential widens and EUR/USD often falls. 2022-2023 was the textbook case: the energy shock weighed on European growth, the Fed tightened faster, and USD received support from both rate differentials and safe-haven demand.
USD/JPY is the king of carry trades. Use the 2022-2024 range: the Fed was above 5%, the BoJ stayed near zero for a long time, and the rate differential was historically wide. USD/JPY moved from around 115 to around 161. There were interventions, risk-off phases, and position squeezes along the way, but the core backdrop was still carry. As long as the Fed-BoJ differential was not compressed quickly, shorting USD/JPY meant fighting carry.
Gold has the strongest inverse relationship with the 10y real yield. A useful data range is 2021-2025. When real yields rose in 2022, gold was pressured; when real yields pulled back or stopped making new highs in 2023-2024, gold was more likely to break out. In Q4 2024, gold made new highs, but real yields did not make synchronized new lows. That showed a temporary decoupling. Sarah would not immediately say "the framework failed." She would mark it as a tracking item: did central bank buying, geopolitical risk, or positioning temporarily overpower the real-yield channel?
QQQ is highly sensitive to Fed real yields. Use the range from H1 2022 to Q2 2023. In H1 2022, real yields spiked and QQQ fell about 35%. In Q2 2023, real yields pulled back and growth expectations improved, allowing QQQ to rebound. Tech-stock traders often focus only on the earnings narrative, but a macro desk looks at the discount rate first. If real yields rise quickly, even a strong AI narrative can be weakened by valuation discount pressure.
CPI data comes in 30 bps above expectations. Assume the Fed quickly follows inflation with higher hike expectations. What is the likely impact on 10y real yield?
After CPI beats expectations, the first 1-minute EUR/USD candle drops, but Fed funds futures barely reprice. Based on sections 1-4, how should you judge it?
4. Fed Funds Futures Basics
CME Fed Funds futures show the market-implied probability for future Fed policy. They are not a crystal ball. They only tell you how much probability of cuts or hikes has already been put into current prices.
If the next meeting has a 90% probability of a 25 bps hike, the market has priced in about 22.5 bps. After data is released, if that probability falls from 90% to 50%, the implied move changes from 22.5 bps to 12.5 bps. That 10 bps repricing is why USD moves immediately.
This is why "NFP beat, so dollar rally" is an incomplete sentence. The right questions are: What was consensus? What was the whisper number? What happened to wage growth? Did the unemployment rate change? More importantly, what had Fed funds futures already priced in before the data? If the market was already extremely hawkish and NFP only beat slightly, USD may not rise.
Use a three-step read.
First, check current probability before the data. Use CME FedWatch or your terminal, and record the implied rate for the next meeting and the year-end meeting.
Second, immediately check how probability changed after the data. Do not only watch the first 1-minute candle. An FX spike can be liquidity and stop run. Curve repricing is the information.
Third, multiply the probability change by the current carry backdrop. In a high-carry environment, a small dovish repricing may not be enough to reverse the trend. In a low-carry or crowded-positioning environment, the same 10 bps repricing can trigger a larger squeeze.
Sarah rule: Do not trade NFP itself. Trade the probability shift in Fed Funds futures. This is a 1-day decay signal and should not be held for more than 24 hours. On the first day after the data, the market is digesting the rate path. After the second day, new positioning, central bank comments, and risk sentiment begin to cover the original signal.
5. Macro Data Trading Checklist
On the EUR/USD H4 chart, find a move where USD strengthened or weakened. Write how you would use Fed funds futures repricing to verify whether it was driven by rate differentials, instead of only reading the news headline.
Next lesson L1.2: Reading the Central Bank Reaction Function — Not Just the Number, but How the Fed Reads the Number